
Appearance
Dashboards & Widgets
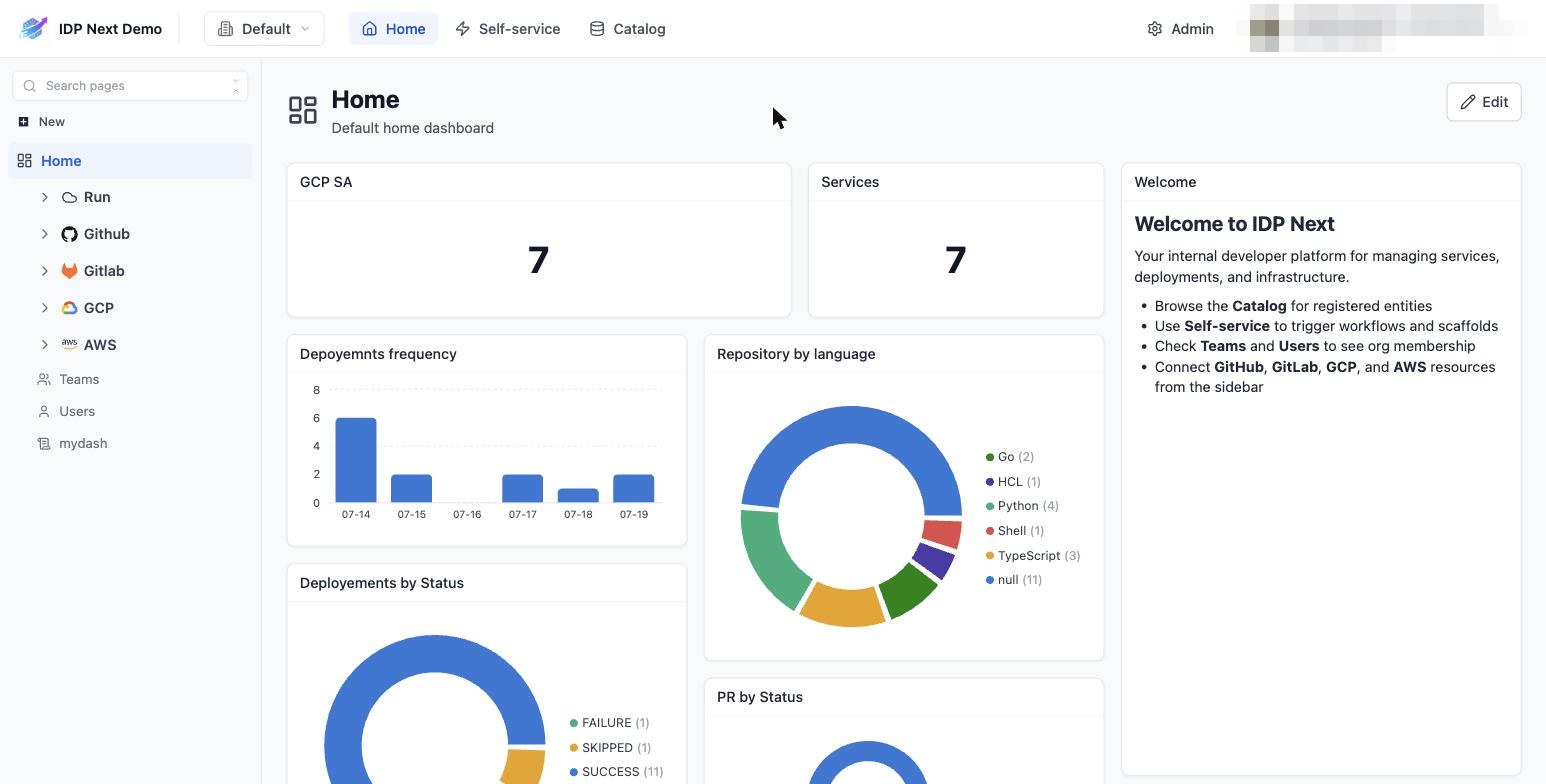
Dashboards visualize catalog data. The Home dashboard is shared by the organization; you can also create your own.
Create a dashboard
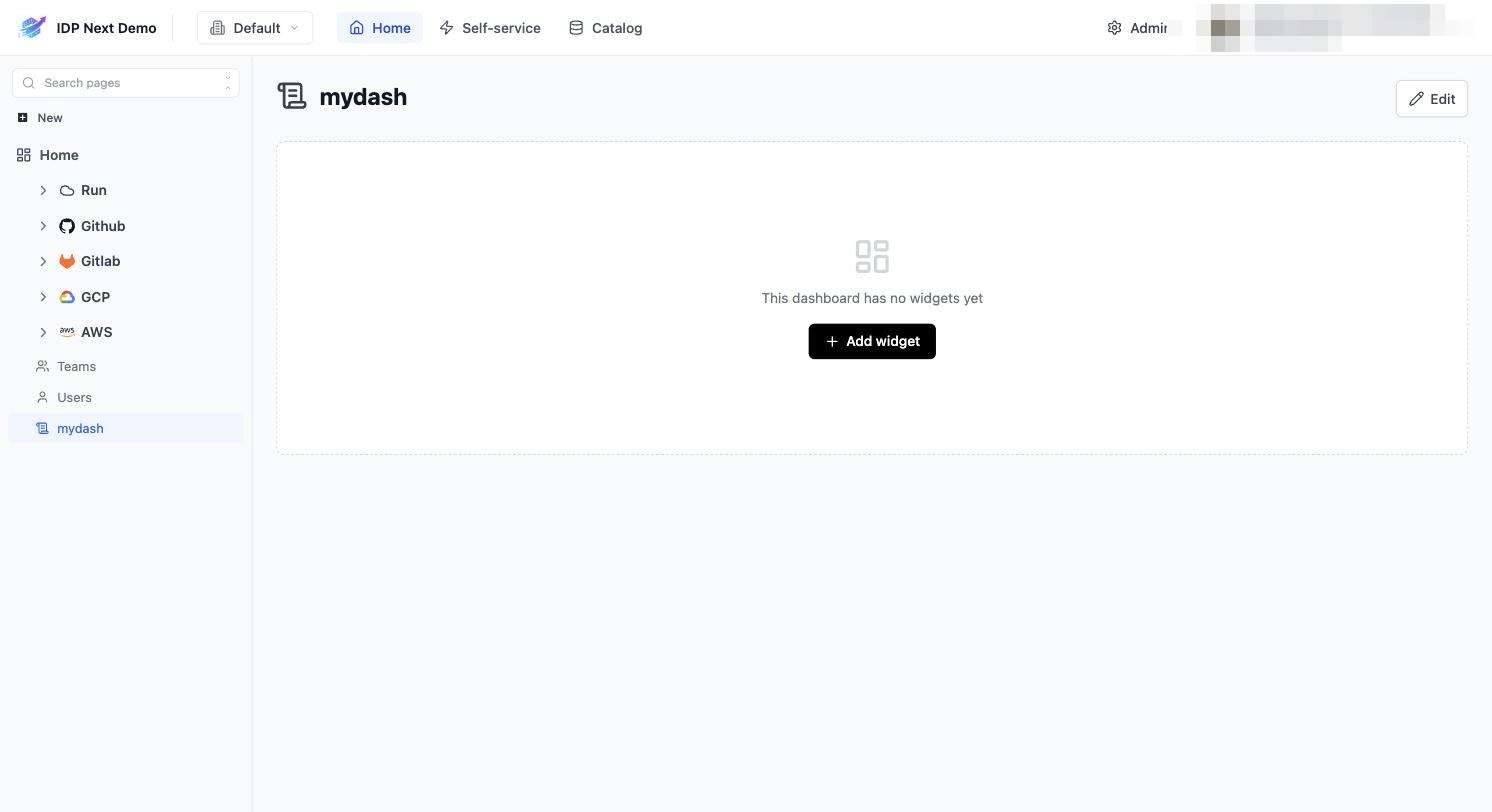
- In the sidebar, click New → New dashboard, give it a name (the demo has
mydash). - A fresh dashboard is empty:
Add widgets
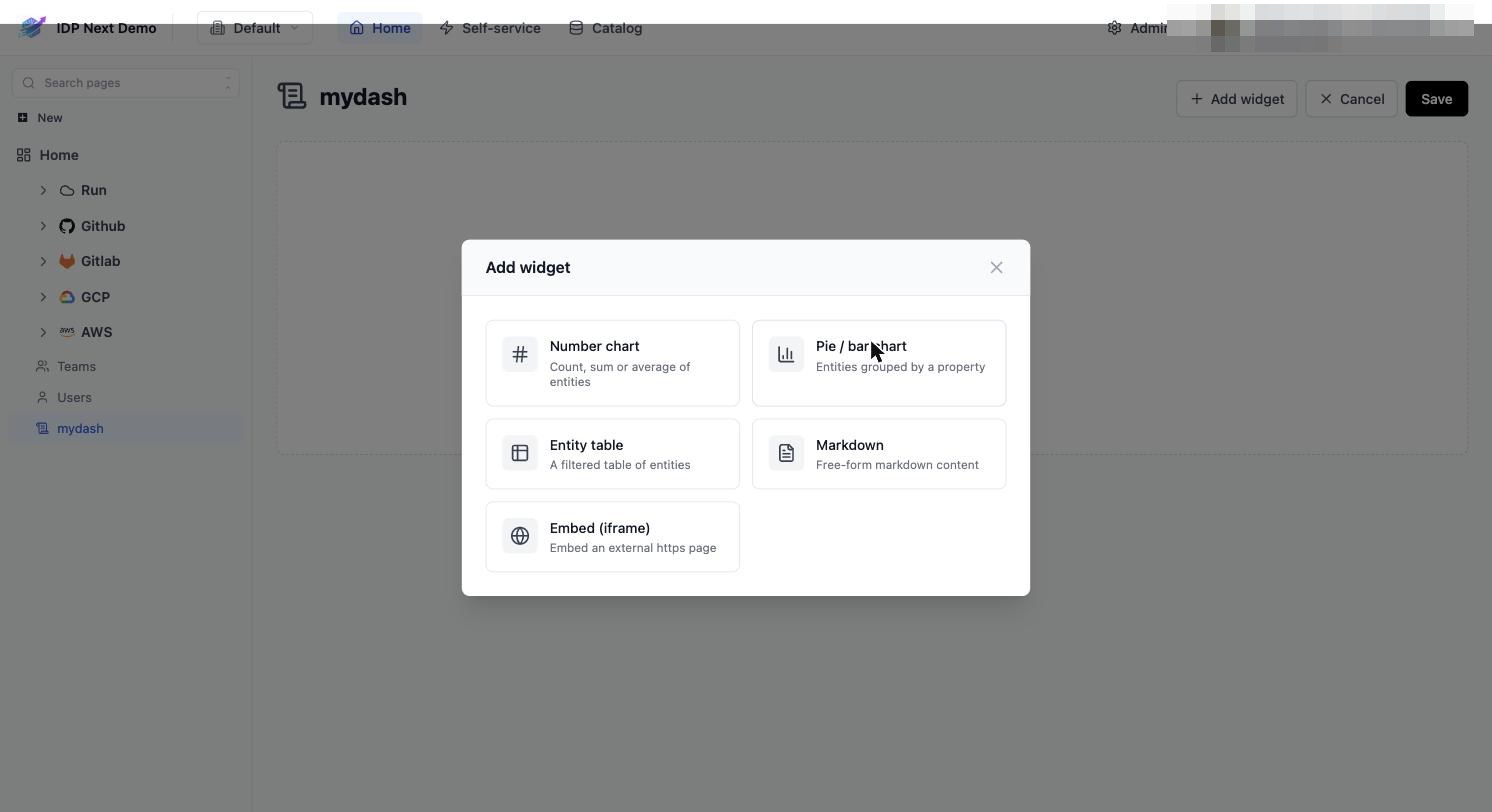
Click Add widget (or Edit on an existing dashboard, then Add widget):
| Widget | Use it for |
|---|---|
| Number chart | count / sum / average of entities — e.g. "Services: 7" |
| Pie / bar chart | entities grouped by a property — e.g. Repository by language, Deployments by status |
| Entity table | a filtered table of entities embedded in the dashboard |
| Markdown | free-form text — welcome notes, links, runbooks |
| Embed (iframe) | any external https page (Grafana, status pages…) |
Each widget is configured with a blueprint + filter + property — e.g. the demo's Deployments by Status pie is the deployment blueprint grouped by status.
Arrange and save
In Edit mode, drag widgets to move them and drag corners to resize; the grid reflows automatically. Click Save to persist (or Cancel to discard). Widgets refresh their data automatically from the catalog.